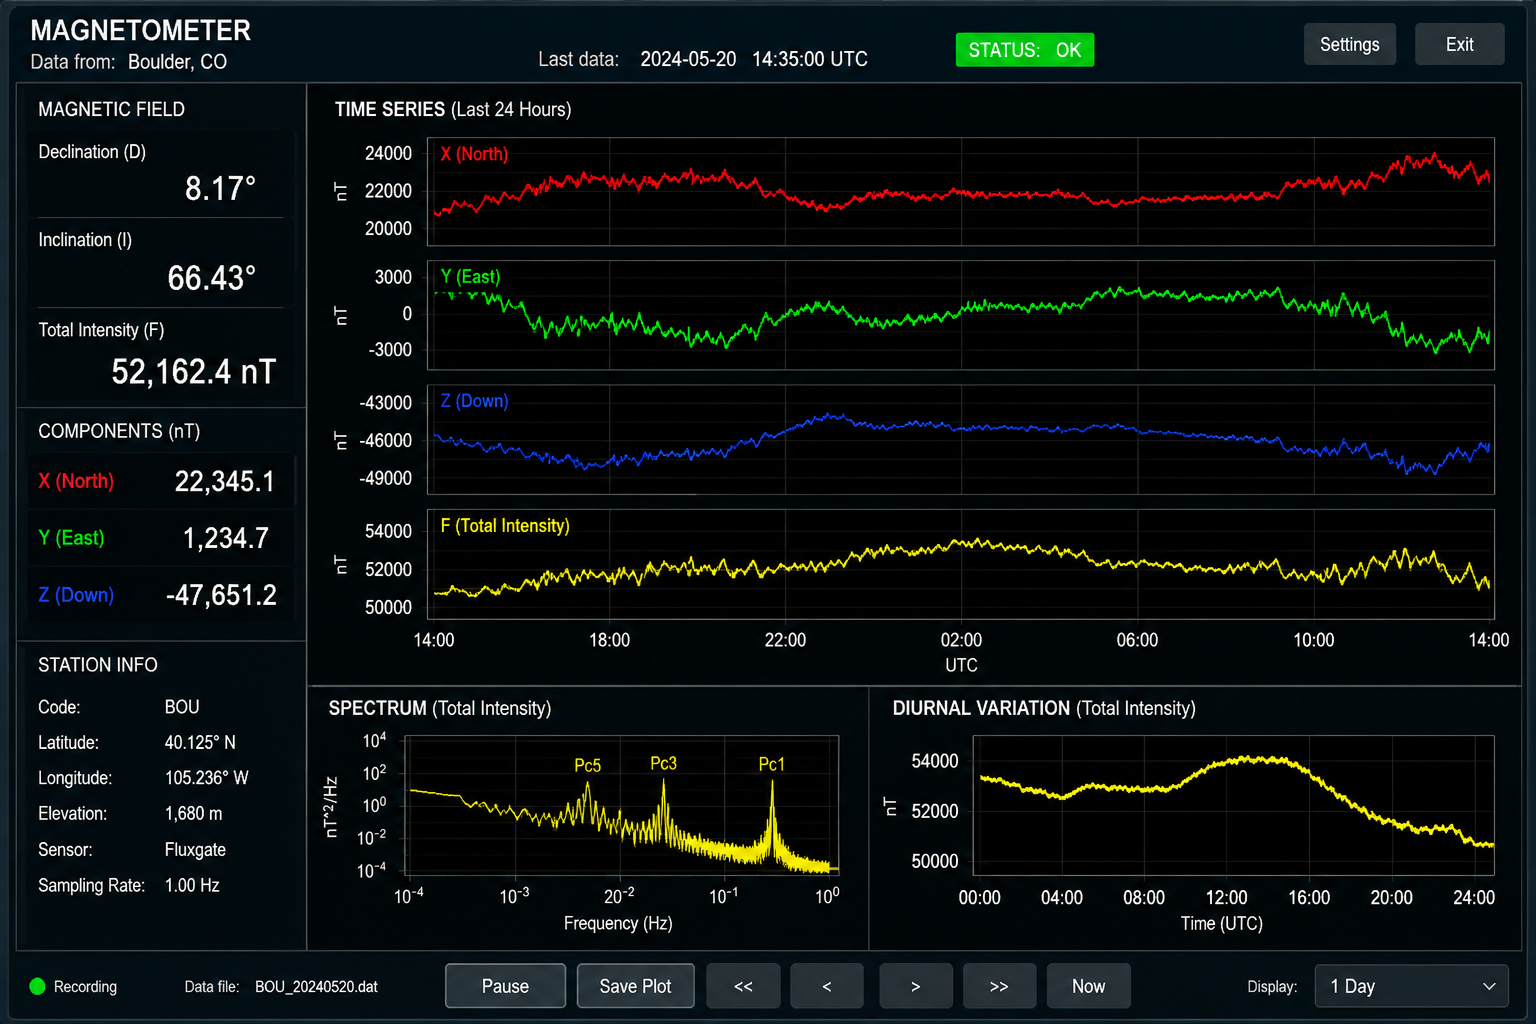
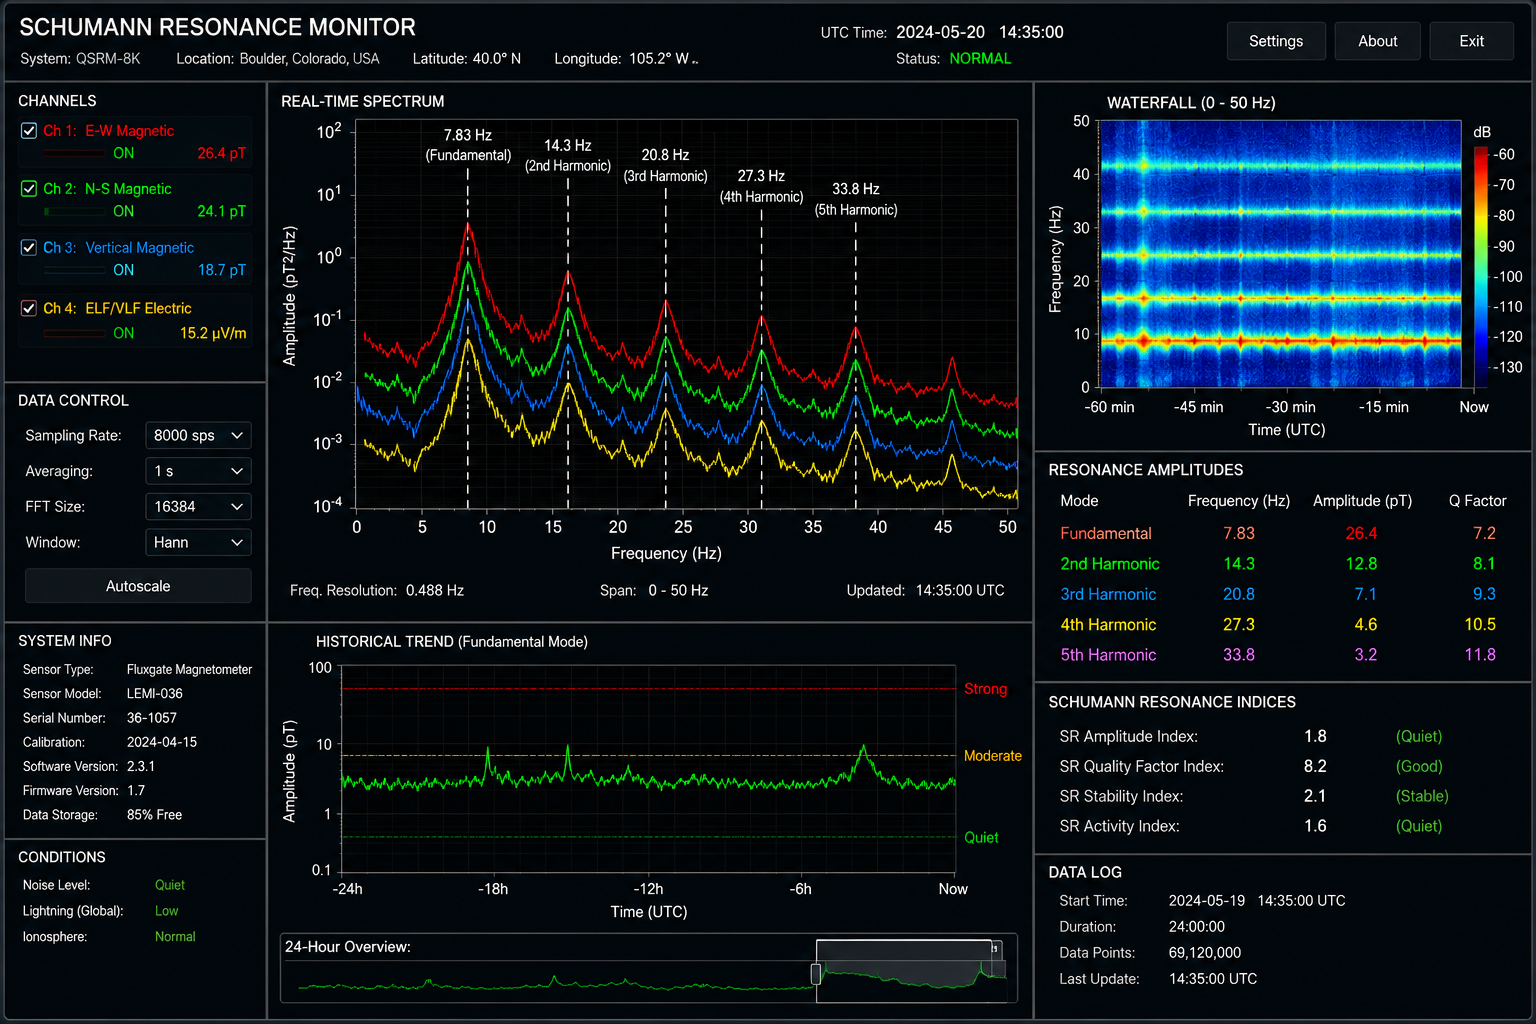
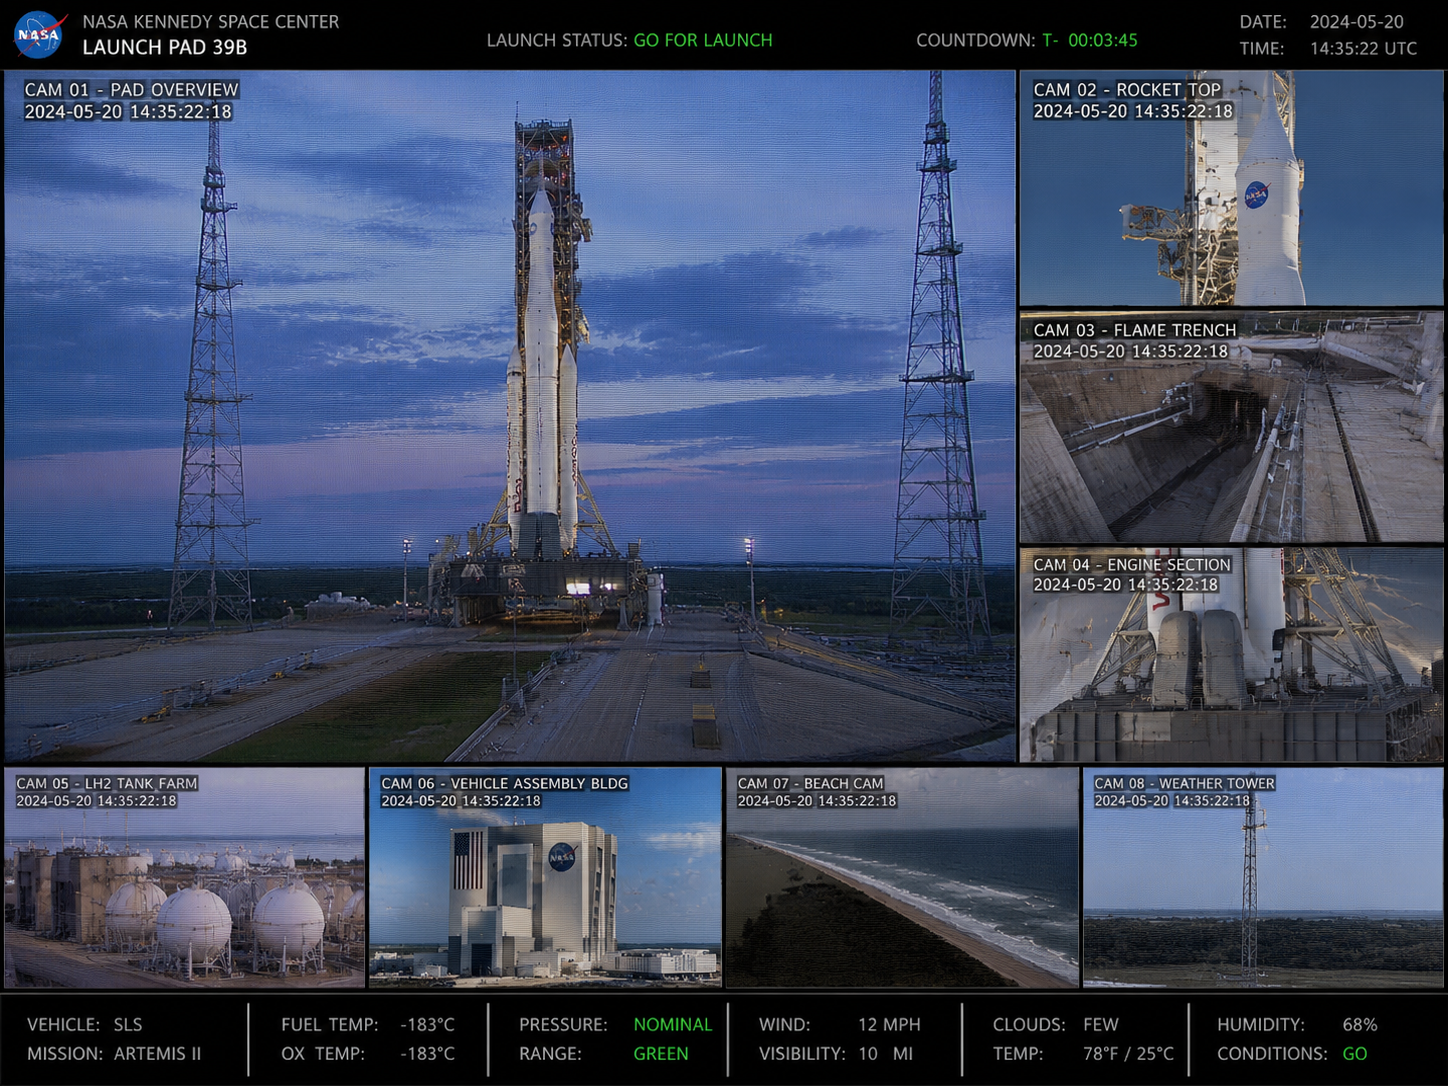
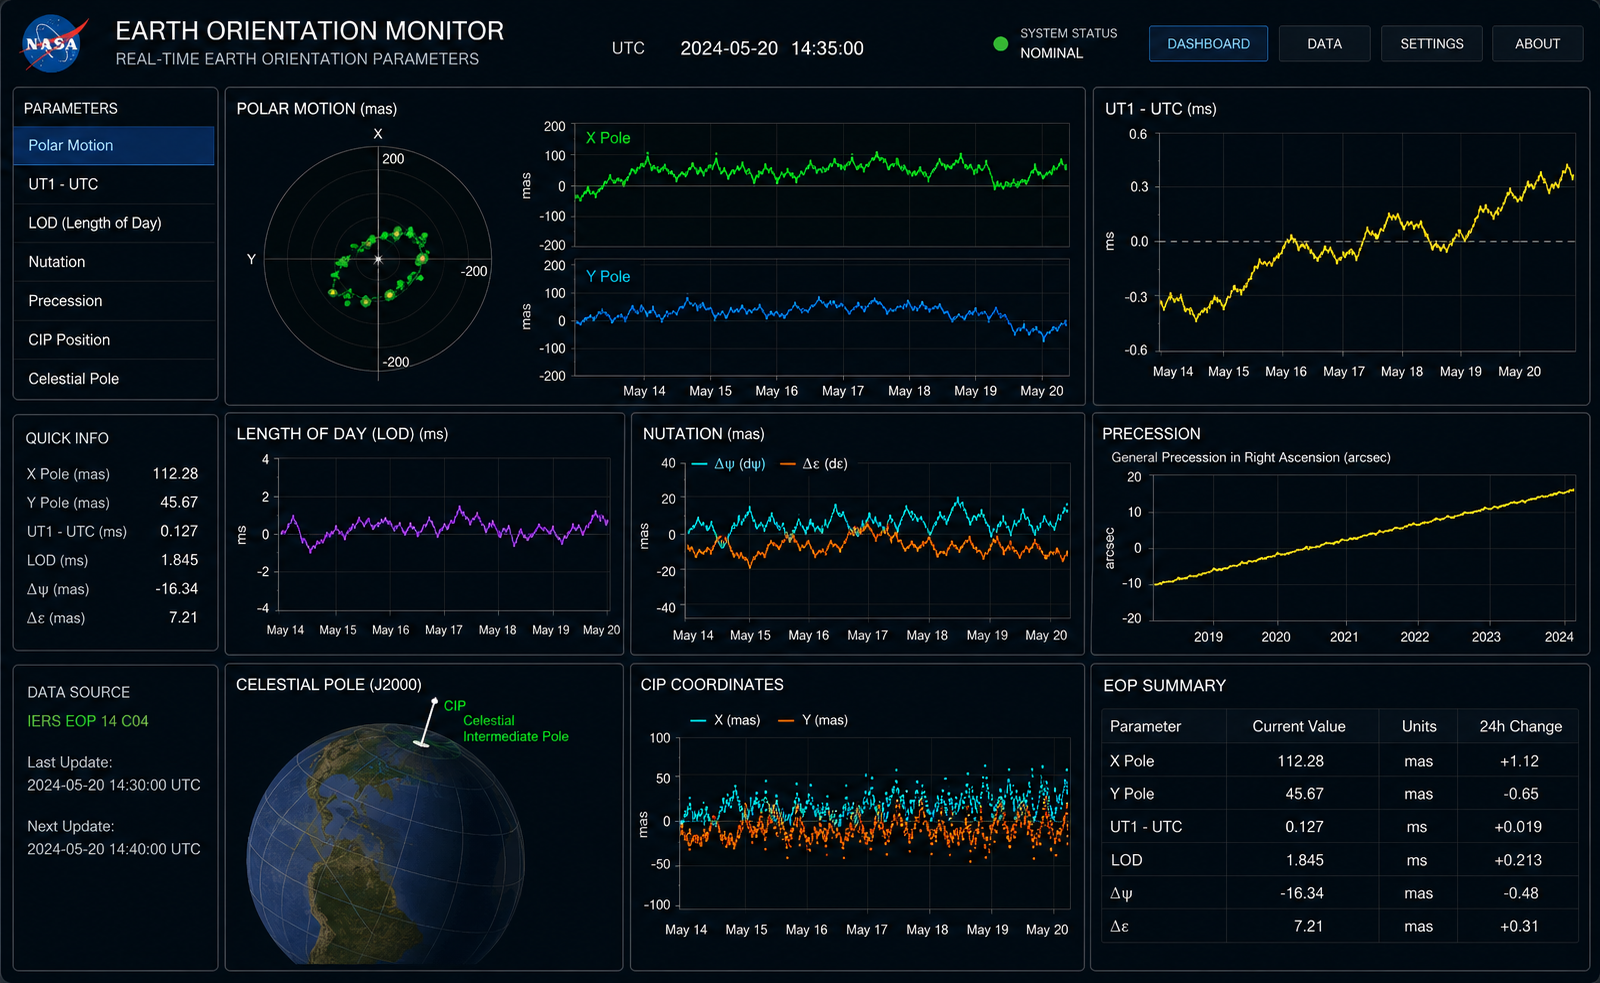
The types of measurements used in The Source are based on real scientific instruments and analysis methods used by organizations such as NASA, NOAA, universities, and geophysical observatories.
Common tools and systems include:
Fluxgate magnetometers: Highly sensitive instruments used to measure the strength and direction of Earth’s magnetic field.
Proton precession magnetometers: Magnetometers that measure total magnetic field intensity using the resonance behavior of hydrogen protons.
Superconducting magnetometers: Extremely precise magnetic sensors, often using SQUID technology, capable of detecting minute magnetic fluctuations
ELF/VLF radio receivers: Systems designed to detect extremely low frequency and very low frequency electromagnetic signals traveling through Earth and the atmosphere.
Schumann resonance monitoring stations: Monitoring systems that measure natural electromagnetic resonances occurring between Earth’s surface and the ionosphere.
Seismometers: Instruments that detect and record ground motion, earthquakes, and crustal vibrations.
GPS timing networks: High-precision satellite timing systems used to synchronize measurements and monitor Earth movement and positional changes.
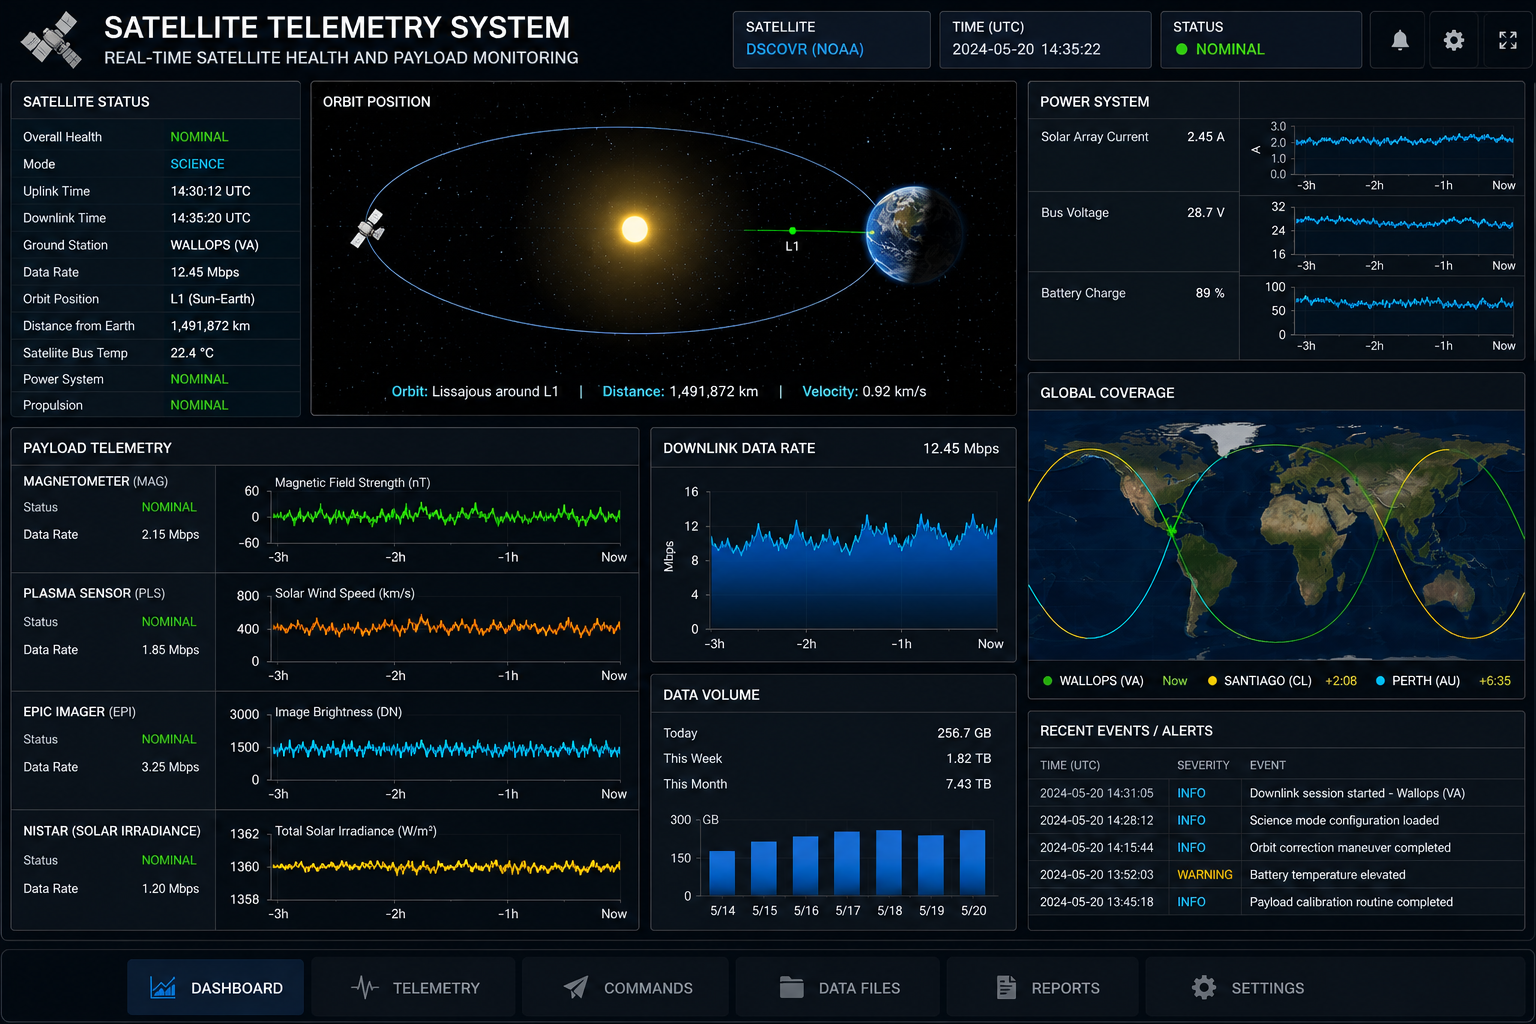
Satellite telemetry systems: Space-based monitoring systems that transmit environmental, magnetic, atmospheric, and geophysical data back to Earth.
Earth orientation monitoring systems: Scientific systems that track Earth’s rotation, axial tilt, wobble, and subtle changes in planetary motion.
Spectral analysis software: Software that analyzes complex signals by separating them into their component frequencies and harmonics.
Interferometry and phase-correlation systems: Analytical systems that compare signals from multiple sensors to detect synchronization, timing differences, and coherent patterns.
SIT AT CHRISTINA”S DESK